Facebook plunged 54% after its IPO before staging a historic recovery.
Now Roze AI is showing early signs of a possible technical base: a higher latest intraday low, tightening volatility, and declining trading volume.
Here’s why short-term traders are taking a closer look at the chart.
Before the Biggest Recoveries, Something Changes
Facebook lost 54% of its value after its 2012 IPO.
Amazon collapsed more than 90% during the dot-com crash. Uber traded roughly 67% below its IPO price.
All three eventually staged extraordinary recoveries.
But the fascinating part isn’t where those stocks ultimately went.
It’s what happened when they stopped going down.
The selling slowed. Price patterns began changing. Buyers eventually established higher lows, and sustained recoveries developed as their businesses evolved.
Now consider Roze AI (NASDAQ: RZAI).
From its October 1 closing price of $26.31 to its October 16 close of $9.82, RZAI declined approximately 63%.
The decline was dramatic. But the latest sessions reveal something different.
Three technical developments suggest the stock may be entering an early stabilization phase.
And the Facebook comparison offers a particularly interesting lesson about what that phase can look like.
Signal #1: Buyers Are Beginning to Defend the Lows
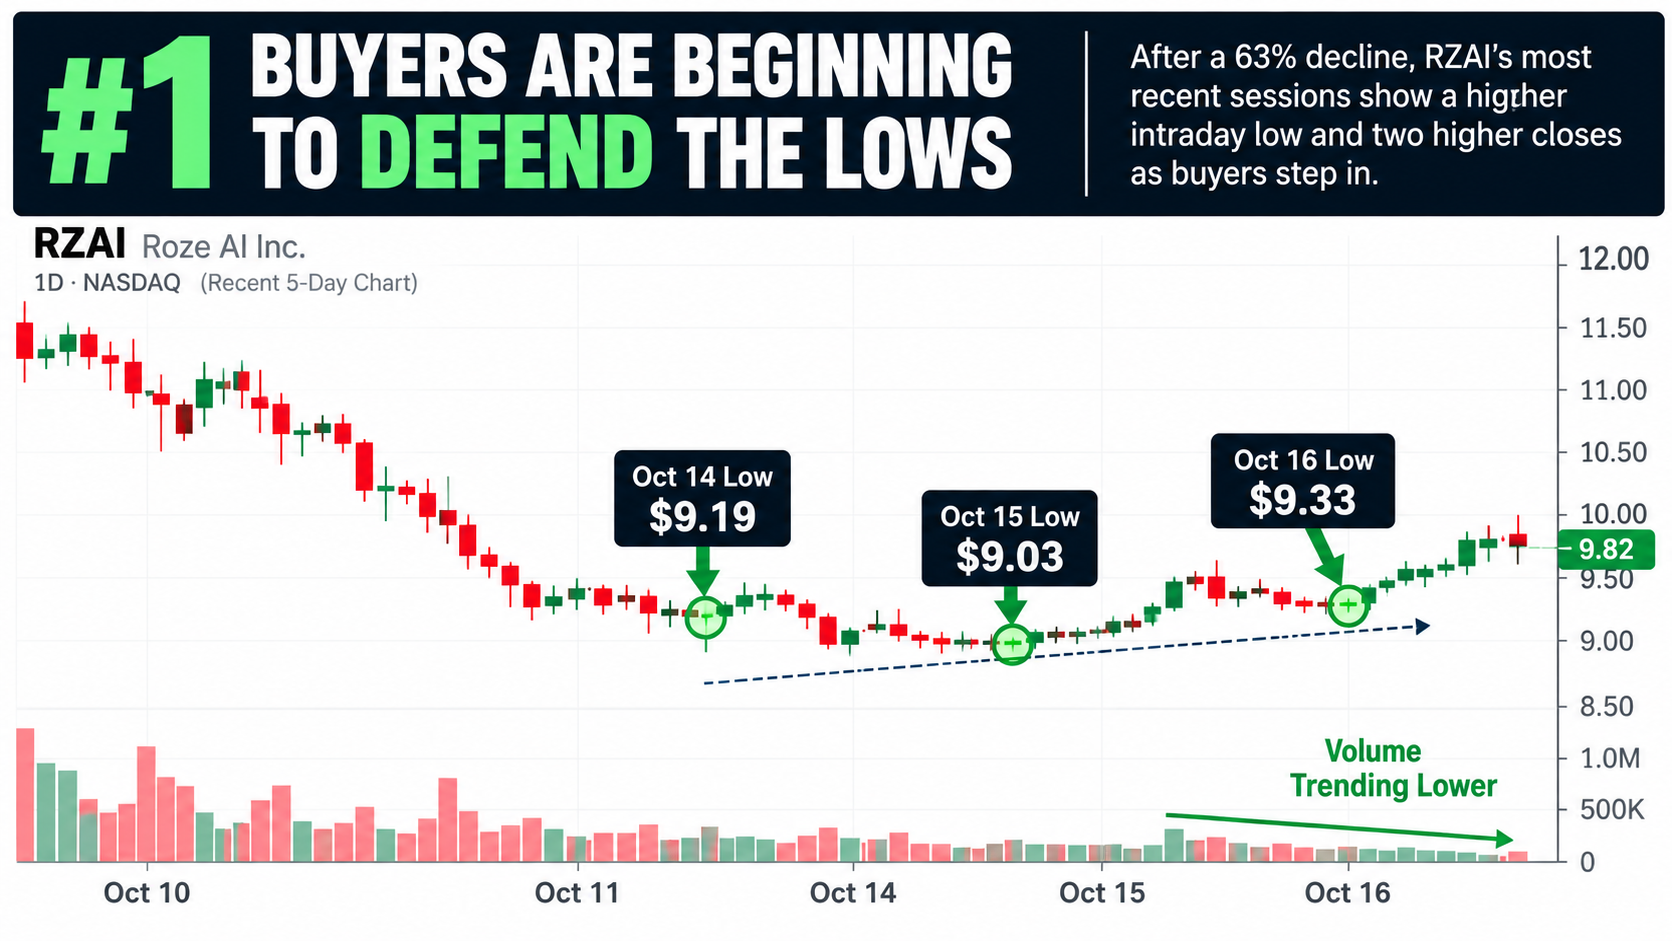
On October 15, RZAI touched $9.03 before recovering to close at $9.81.
The following session, the stock’s intraday low rose to $9.33, and it finished at $9.82.
Two consecutive higher closing prices, together with Friday’s higher intraday low, represent an early improvement in price behavior.
The stock has not established a sustained uptrend. But its most recent session suggests sellers were unable to push it back to Thursday’s low.
For traders studying potential reversals, that change is worth watching.
Signal #2: The Chart Is Compressing
This may be the most intriguing technical development.
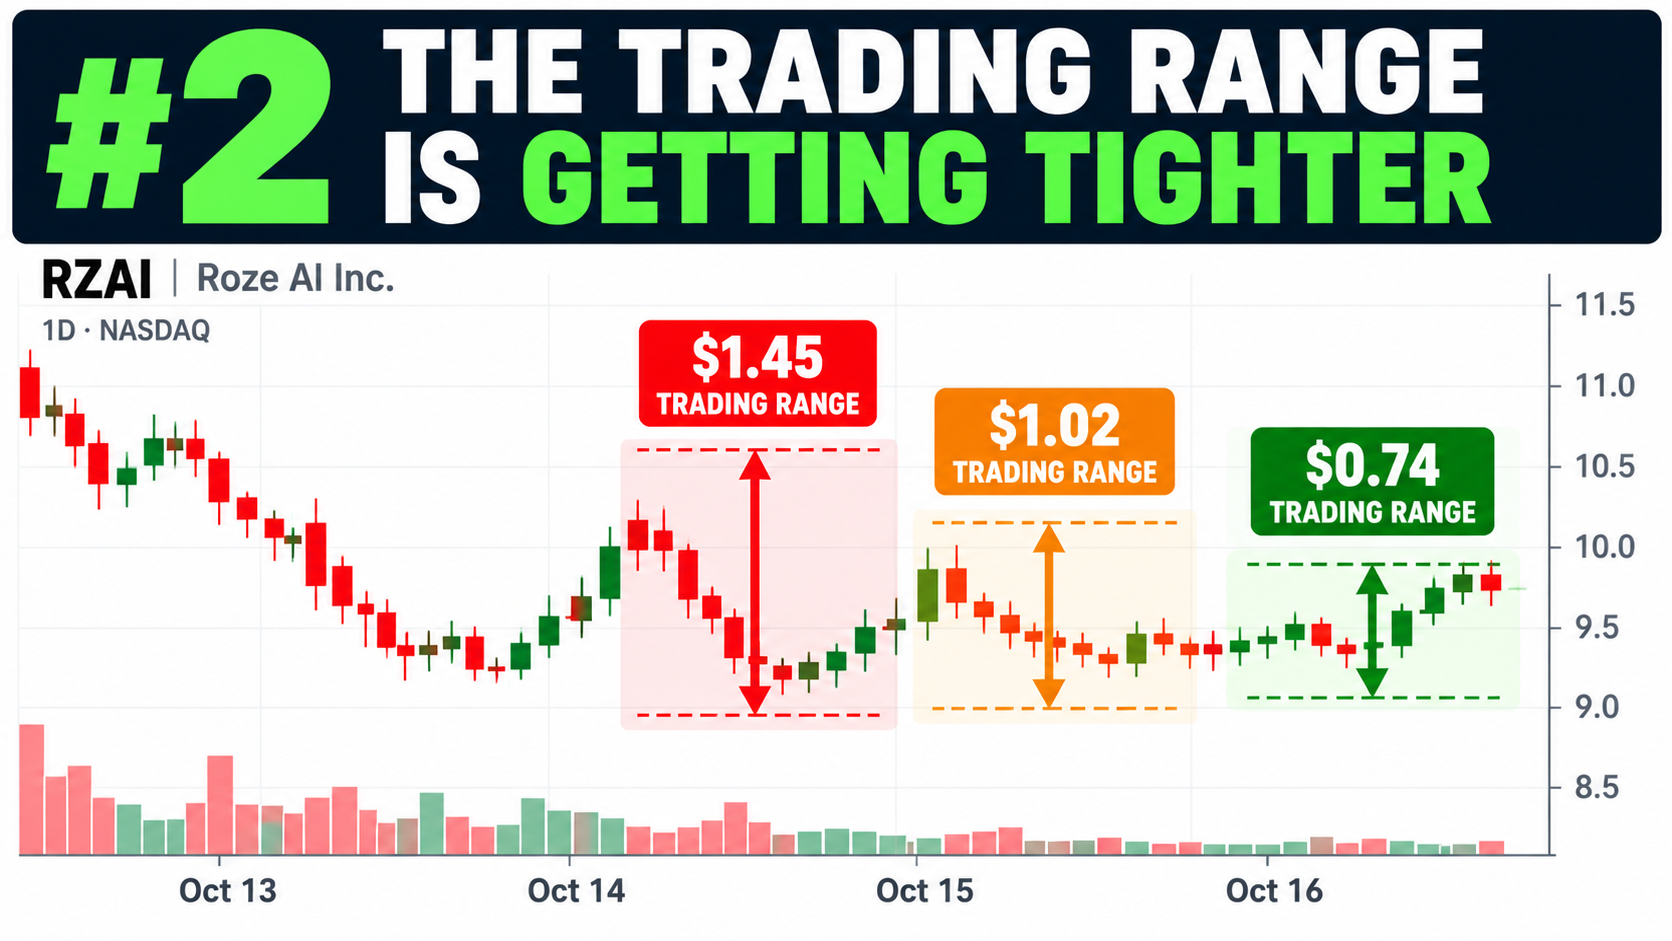
RZAI’s daily trading ranges have narrowed for three consecutive sessions.
| Session | Daily range |
|---|---|
| October 14 | $1.45 |
| October 15 | $1.02 |
| October 16 | $0.74 |
Friday also produced an NR7 pattern—the narrowest daily range of the previous seven sessions.
Technical traders call this volatility compression.
After an aggressive decline, a tightening range can indicate that the market is entering a period of consolidation.
Sometimes that consolidation becomes the foundation for a reversal.
Sometimes it precedes another decline.
The important development is that RZAI’s trading behavior has shifted from violent price swings toward a narrower range.
Signal #3: Volume Has Fallen Approximately 92%
Approximately 900,000 shares traded on October 1.
By October 16, volume had declined to roughly 72,600 shares.
That represents a reduction of approximately 92%.
In technical analysis, sharply declining volume after a selloff can be consistent with diminishing selling pressure.
It can also reflect fading investor interest, so it should not be mistaken for proof of accumulation.
But when price stabilization, contracting volatility, and declining volume appear together, traders have a more specific pattern to investigate.
And this is where the Facebook comparison becomes especially interesting.
Facebook’s Recovery Began With a Change in Its Chart
Facebook’s 2012 collapse didn’t end with a spectacular overnight recovery.
After reaching its September low, Facebook established a higher low in October and a higher high in November.
Its price structure gradually improved.
At the same time, Facebook demonstrated progress in mobile advertising, giving investors stronger evidence that the underlying business could justify renewed confidence.
The eventual recovery was extraordinary.
But the lesson isn’t that every beaten-down technology stock becomes Facebook.
It’s that major recoveries can begin with small, observable changes in market behavior long before a durable uptrend is established.
RZAI has only a few sessions of preliminary stabilization—not the months of confirmation Facebook eventually developed.
Nevertheless, the emerging technical pattern deserves attention on its own merits.
There’s Also a $27 Million Business Story
Roze AI recently announced six South Korean projects with approximately $27 million in combined headline contract values.
The first announcement excluded VAT; the second included it. These amounts are not recognized revenue, and project values and schedules may change.
Still, the announcements represent identifiable commercial activity for a company that reported approximately $2.3 million in 2025 revenue.
Roze AI develops AI-assisted fire-risk monitoring and digital-twin technology for buildings and infrastructure.
Construction at the six project sites is currently expected to begin during the first half of 2027.
The combination is noteworthy: a speculative technology company experiencing severe stock-price repricing while announcing new commercial agreements.
Whether those contracts translate into sustainable revenue remains an open question.
Following RZAI? Don’t Miss the Next Development.
Get free RZAI breaking-news alerts, technical updates, and emerging-stock coverage from SmallCapExclusive.
Follow the evolving RZAI chart alongside developments in other small-cap technology companies.
Receive email news and analysis. No guaranteed delivery timing or investment returns. Unsubscribe anytime.
The Bigger Picture: A Potential Base Is Beginning to Emerge
Here’s what makes RZAI worth a closer look.
Following a nearly 63% decline, the stock has produced a higher latest intraday low, two higher closing prices, three consecutive narrowing trading ranges, and dramatically reduced volume.
No individual signal confirms a bottom.
And together, they still fall short of establishing a durable uptrend.
But they describe a market beginning to behave differently from the one that produced the initial collapse.
Facebook’s recovery offers a useful historical reminder: the transition from selling pressure to sustained buying interest can begin gradually.
RZAI’s transition, if one develops, remains in its earliest stages.
The company also faces substantial financial, execution, dilution, and trading risks. A potential base can fail, and historical recoveries offer no guarantee of future results.
The story isn’t simply that RZAI fell 63%.
It’s that after falling 63%, the chart is beginning to change.
For short-term traders studying post-IPO volatility and potential momentum reversals, that makes RZAI a compelling name for a research watchlist.
Because sometimes the most interesting chapter begins when the selling finally starts to quiet down.
ADD TO YOUR WATCH LIST TODAY
PAID ADVERTISEMENT. Small Cap Exclusive is owned and operated by King Tide Media, LLC. SGNL Media Group LLCis the paying party for this investor-awareness campaign relating to Roze AI Inc. (NASDAQ: RZAI). King Tide Media, LLC may receive compensation of up to $1,000,000 in connection with this campaign, which commenced September 25, 2026. Full Disclaimer