ShiftPixy PIXY up huge
ShiftPixy PIXY up huge after heavy volume after the last few days. The stock skyrocketed up over 100% in two trading days. The stock is currently consolidating and deciding what it wants to do next.
Let’s take a quick look at ShiftyPixy
Company Name: ShiftPixy, Inc.
Ticker: (PIXY)
Exchange: NASDAQ
Company Summary:
ShiftPixy is inching closer to its goal of becoming a national staffing leader after raising $115 million in an initial public offering for Industrial Human Capital, a blank check company formed to acquire industrial staffing companies.
Industrial Human Capital is one of four special purpose acquisition companies (SPACs) formed by ShiftPixy, a Miami-based platform that connects businesses with short-term hires and gig workers.
Why did it go up over 100%?
No big news, just this. I don’t think that warrants the incredible increase in share price.
ShiftPixy PIXY) 1 Day Chart
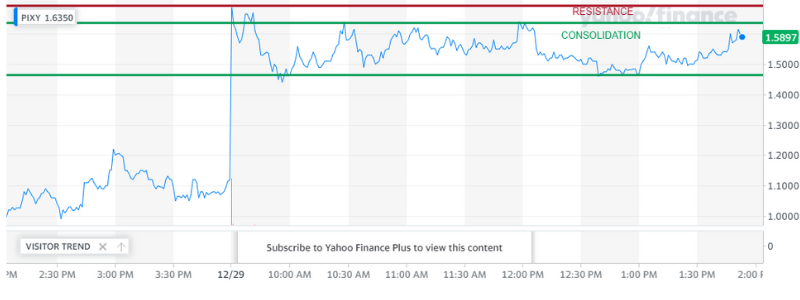
ShiftPixy PIXY Technical Analysis:
It has been consolidating the whole day after a morning rush of volume driving the PPS up almost 50% with high volume. The stock seems very stable in the consolidation pattern. I would wait till PIXY breaks above $1.68 or at least $1.64 before considering a purchase.
I would place my stop loss at $1.45, because, if it goes below, it will pull back. The stock is very interesting with relatively no news and feels like an awareness campaign but the stock is stable. Wait for confirmation at $1.64 before moving on it and make sure to keep an eye on it.

Reliance Global Group RELI is very bullish

Let’s take a quick bird’s eye view of Reliance Global Group RELI and why RELI is up over 200% in less than two weeks. Before we get started, let’s go over the particulars.
Company Name: Reliance Global Group
Ticker: RELI
Exchange: NASDAQWebsite: https://www.relianceglobalgroup.com/
Reliance Global Group Company Summary:
Reliance Global Group, Inc. (NASDAQ: RELI, RELIW) is combining advanced technologies, with the personalized experience of a traditional insurance agency model.
Also, Reliance Global Group’s growth strategy includes both an organic expansion as well as acquiring well managed, undervalued and cash flow positive insurance agencies.
Why did it go up over 200%?
Reliance Global Group RELI announced a private placement of preferred stock, common stock and warrants for gross proceeds of $20.0 million before deducting the placement agent’s fees and other estimated offering expenses.
The offering is expected to close on or around December 27, 2021.
Reliance Global Group RELI 1 Day Chart:
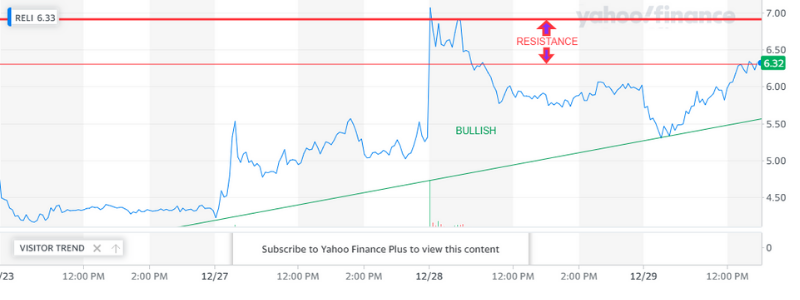
RELI technical analysis
I expect it to consolidate in between $6.13 & $6.36 before the next move. I’m feeling good about this stock and believe with the big news and the overall bullish trend in the 5 day and 1 day that it is a stock to watch carefully!
If the stock falls below $6.13, that is an indicator of a pullback so be careful!

Meso Numismatics (MSSV) skyrocketing
Meso Numismatics (MSSV) up over 200% in a week
Company Name: Meso Numismatics (MSSV)
Ticker: MSSV
Exchange: OTC Website: www.stemcellsgroup.com
Company Summary:
Meso Numismatics, Inc. acquired Global Stem Cells Group (Global) is a premier Regenerative Medicine company that specializes in cutting edge stem cell research, current clinical applications, and physician training.
Global licenses its intellectual property and name to medical professionals around the world providing them with necessary equipment and cellular therapy products needed to perform safe and effective Regenerative Medicine related treatments.
Global has one of the largest physician membership networks in the world with 29 offices in more than 25 countries.
Why did it go up over 200%?
There is no news out or press releases. It appears to be an awareness campaign. I do find Meso Numismatics acquisition of Global Stem Cells Group (Global) four months ago as a good omen. Global is a premier Regenerative Medicine company that specializes in cutting edge stem cell research, current clinical applications, and physician training.
Meso Numismatics (MSSV) 5 Day Chart
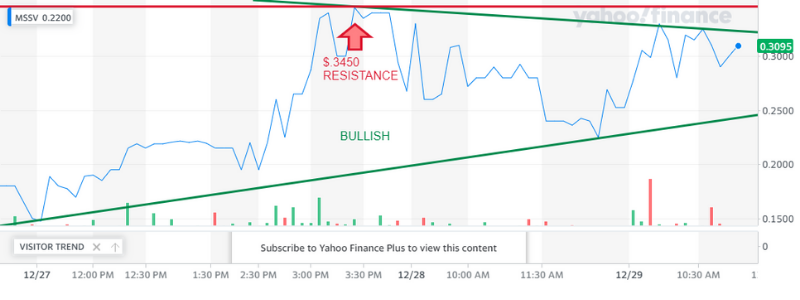
Meso Numismatics (MSSV) technical analysis shows there is resistance at $.33 & $.345, be sure to break through those resistance points before considering a purchase.
MSSV is trending bullish in the 5 day chart and month chart but is showing bearish tendencies in the one day chart. There is thin volume on this stock so be aware of that as you proceed.